Example 3: Folium
This example provides a quick overview on how to create a Folium map with some simple shapes.
To get started, go to mecsimcalc.com/create, click on Maps, and select Drawing shapes.
Step 1: Inputs
For the inputs, create a Single Select with the following properties:
- Name: map_tile
- Label: Map Tile
- Options:
- OpenStreetMap
- Stamen Terrain
- Stamen Toner
- Stamen Watercolor
and create a Color Picker with the following properties:
- Name: color
- Label: Shape color
- Default value: #43BFF5
Step 2: Code
Creating a map
Start by creating a Folium map instance, m that has the following attributes:
location: the initial center of the map in latitude and longitude.zoom_start: the initial zoom level.tiles: map tiles.- Map tiles specify the type of map to use, such as satellite vs. road.
"OpenStreetMap"is the standard tile used to see roads.- See possible map tiles here.
m = folium.Map(location=[45.372, -121.6972],
                zoom_start=15, tiles=inputs['map_tile'])
Adding shapes
To add shapes to your map, first create the shape and then use .add_to(m) to add it to your map.
Add two Markers to your map:
locationis the marker position in latitude and longitude.popupshows up when you click on the marker. You can use HTML in the string.tooltipshows up when you hover over the marker.iconis the optional icon for the marker.
folium.Marker(
    [45.372, -121.6972], popup="<i>Italic popup text</i>", tooltip="Click on Marker"
).add_to(m)

folium.Marker(  # Marker with icon
    location=[45.371, -121.683],
    popup="<b>Bold popup text</b>",
    tooltip="Click on Marker",
    icon=folium.Icon(color=inputs['color'], icon="info-sign"),
).add_to(m)
Add a PolyLine to your map:
locationsis the list of points that when connected makes up the line.coloris the color of the line as a hex color code.tooltipshows up when you hover over the PolyLine.weightis the line thickness.opacityis the transparency of the line.
lat_lng_points = [[45.372, -121.6972],
                    [45.373, -121.6831],
                    [45.371, -121.683]]
folium.PolyLine(locations=lat_lng_points,
                color=inputs['color'],
                tooltip="PolyLine",
                weight=5,  # line thickness
                opacity=0.8  # transparency
                ).add_to(m)
Add a Circle to your map:
radiusis the radius of the circle.locationis the center of the circle in latitude and longitude.tooltipshows up when you hover over the Circle.popupshows up when you click on the circle. You can use HTML in the string.coloris the color of the circle as a hex color code.
folium.Circle(
    radius=100,
    location=[45.372, -121.6972],
    tooltip="Click on Circle",
    popup="Circle",
    color=inputs['color'],
    fill=False,
).add_to(m)
Exporting the map
Finally to export the map, simply use ._repr_html_() to convert the Folium map object into HTML that can be displayed in the output step.
map_html = m._repr_html_()
return {"map": map_html}
Full code
import folium


def main(inputs):
    # Create a folium map
    m = folium.Map(location=[45.372, -121.6972],
                   zoom_start=15, tiles=inputs['map_tile'])

    # Add markers to map
    folium.Marker(
        [45.372, -121.6972], popup="<i>Italic popup text</i>", tooltip="Click on Marker"
    ).add_to(m)
    folium.Marker(  # Marker with icon
        location=[45.371, -121.683],
        popup="<b>Bold popup text</b>",
        tooltip="Click on Marker",
        icon=folium.Icon(color=inputs['color'], icon="info-sign"),
    ).add_to(m)

    # Add line shape
    lat_lng_points = [[45.372, -121.6972],
                      [45.373, -121.6831],
                      [45.371, -121.683]]
    folium.PolyLine(lat_lng_points,
                    color=inputs['color'],
                    tooltip="PolyLine",
                    weight=5,  # line thickness
                    opacity=0.8  # transparency
                    ).add_to(m)

    # Add circle shape
    folium.Circle(
        radius=100,
        location=[45.372, -121.6972],
        tooltip="Click on Circle",
        popup="Circle",
        color=inputs['color'],
        fill=False,
    ).add_to(m)

    # Export folium map as HTML string
    map_html = m._repr_html_()

    return {"map": map_html}
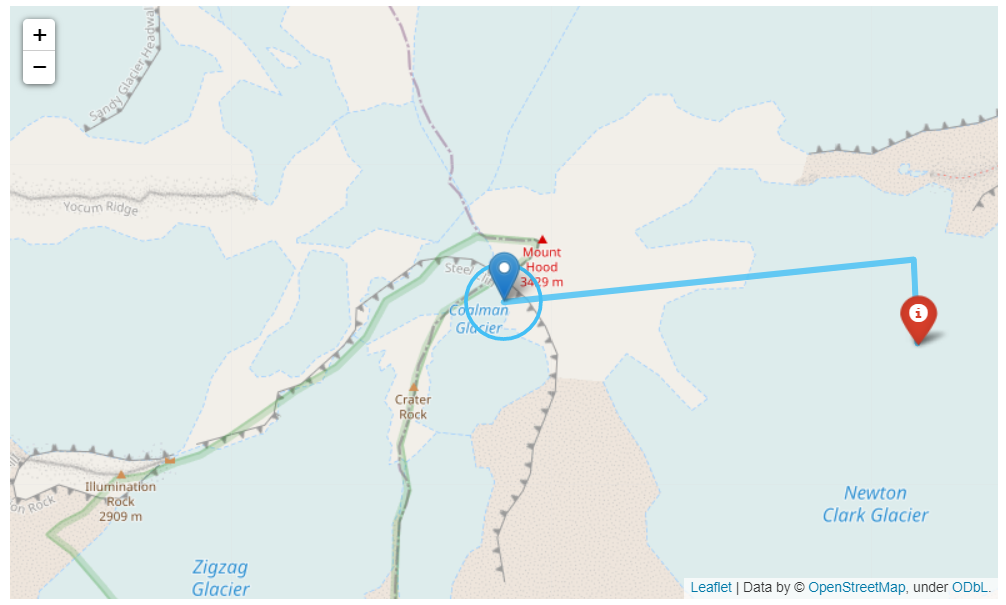
Step 3: Output
{{ outputs.map }}