Overview
MecSimCalc supports the displaying of maps and makes working with geospatial data easy. Two popular Python libraries used in working with maps are GeoPandas and Folium.
Interactive map means the user can interact with the map through dragging, zooming, panning, hovering, and clicking actions.
Static map means the map is an image that can not be interacted with.
GeoPandas
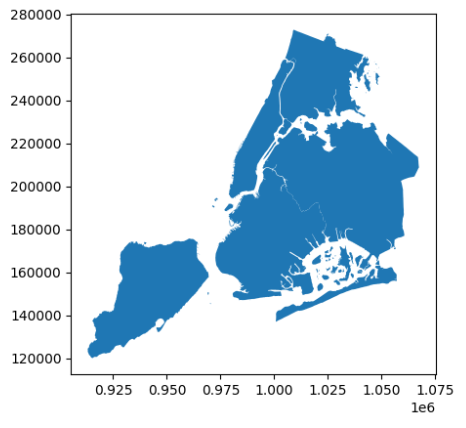
GeoPandas makes working with geospatial data in Python easier. GeoPandas extends the datatypes used by Pandas to allow spatial operations on geometric types. Geometric operations are performed by shapely. GeoPandas further depends on fiona for file access and matplotlib for plotting.
GeoPandas should be used when you either have a lot of data, have data structured as a table, or need to manipulate geospatial data. GeoPanda's GeoDataFrame is an extension of Panda's DataFrame, making it easy to manipulate large amounts of geospatial data.
Once the geospatial data to be visualized is stored as a GeoDataFrame, it can easily be exported as an interactive Folium map or as a static Matplotlib plot.
All of Panda's DataFrame methods can similarly be applied to GeoPanda's GeoDataFrame.
You can think of GeoDataFrame as a Panda's DataFrame with added functionality for geospatial data.
See GeoPandas documentation here.
For detailed examples, see example 1 and example 2.
Folium
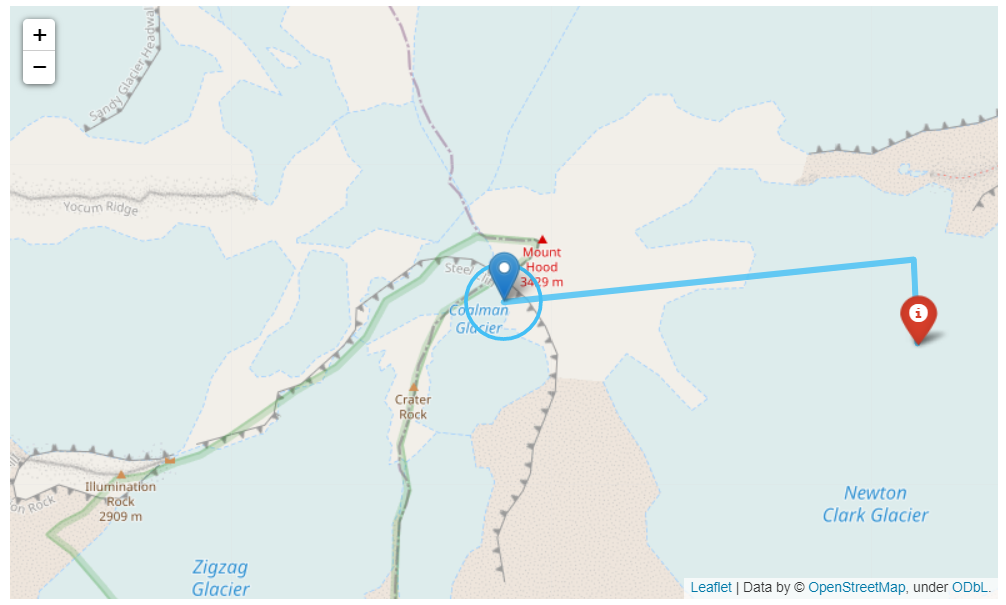
Folium builds on the data wrangling strengths of the Python ecosystem and the mapping strengths of the Leaflet.js library. Folium makes it easy to visualize data that’s been manipulated in Python on an interactive Leaflet map. It enables both the binding of data to a map for choropleth visualizations as well as passing rich vector/raster/HTML visualizations as markers on the map.
Folium is an interactive mapping library that displays a map that the user can drag, zoom, pan, click, and hover on. It also allows the drawing of shapes, such as lines, markers, and circles.
Folium lacks the data manipulation of GeoPanda's GeoDataFrame, and therefore, should only be used independently when visualizing very few data points. It is possible to prepare your data as a GeoDataFrame, and then export it as a Folium map, as demonstrated in the examples.
See Folium documentation here.
For a detailed example, see example 3.