Animated Plots
Animated plots are a great way to visualize data that changes over time. In this example, we will show you how to create an animated plot using the matplotlib library in Python.
Method 1: Using animate_plot function
To create an animation, all you need is your x and y values and the animate_plot function from the MecSimCalc library. The animate_plot function takes in the x and y values, the duration of the animation in seconds, and the title of the plot
import mecsimcalc as msc
import numpy as np

def main(inputs):
  # Define x and y values
  x = np.linspace(0, 2*np.pi, 100) # 100 points between 0 and 2π
  y = np.sin(x)

  # Create an animated plot
  animation = msc.animate_plot(x, y, title='Sine Wave', show_axes=True)

  return {'animation': animation}
Output
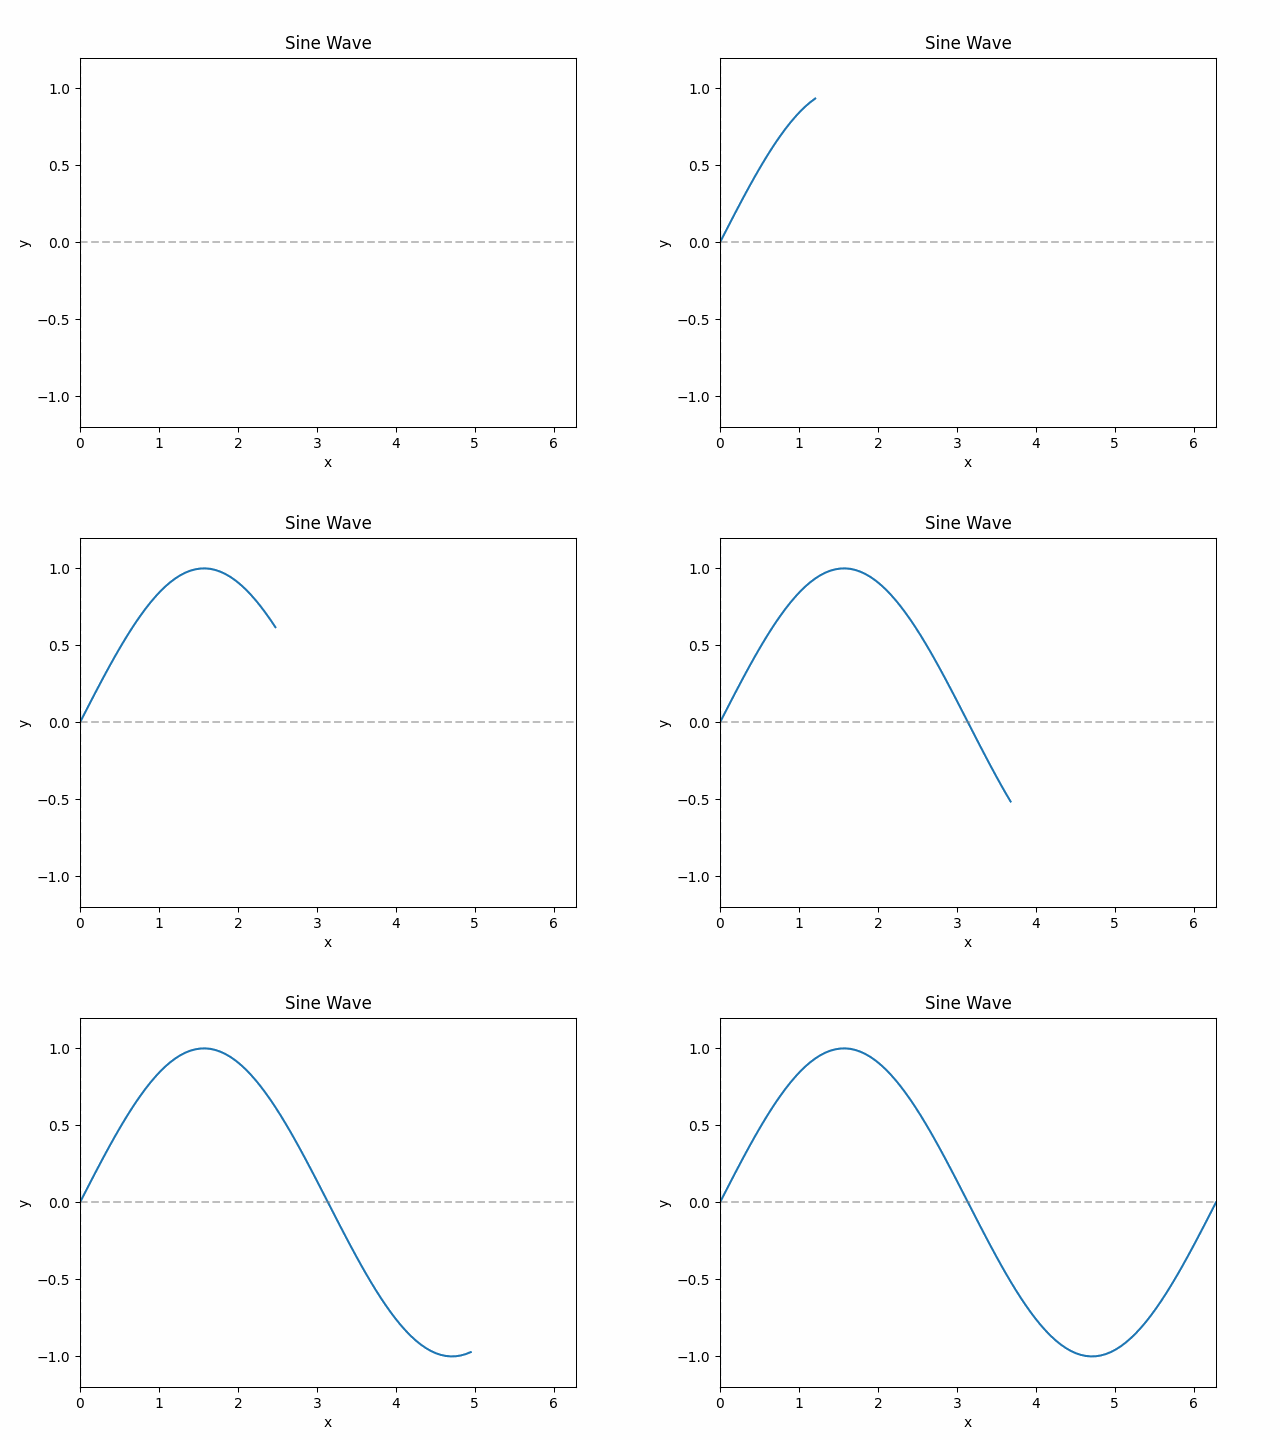
The plot below shows a sine wave being drawn. The animation will run for 3 seconds.

There is a second style of animation that can be created using the animate_plot function. This style of animation is called follow_tip. The follow_tip animation style will animate the plot by moving a tip along the curve. The tip will move from the beginning of the curve to the end of the curve over the duration of the animation.
import numpy as np
import mecsimcalc as msc

def main(inputs):
    x = np.linspace(0, 2*np.pi, 100) # 100 points between 0 and 2π
    y = np.sin(x)
    animation_html = msc.animate_plot(x, y, duration=4, title="Sine Wave", show_axes=True, follow_tip=True, fps=24)
    return {"animation": animation_html}
Output
The plot below shows a sine wave that changes over time. The animation will run for 4 seconds.
-0a3ac549b1c0fdba7fc1a9e716497899.gif)
{{outputs.plot}}
Method 2: Using print_animation function
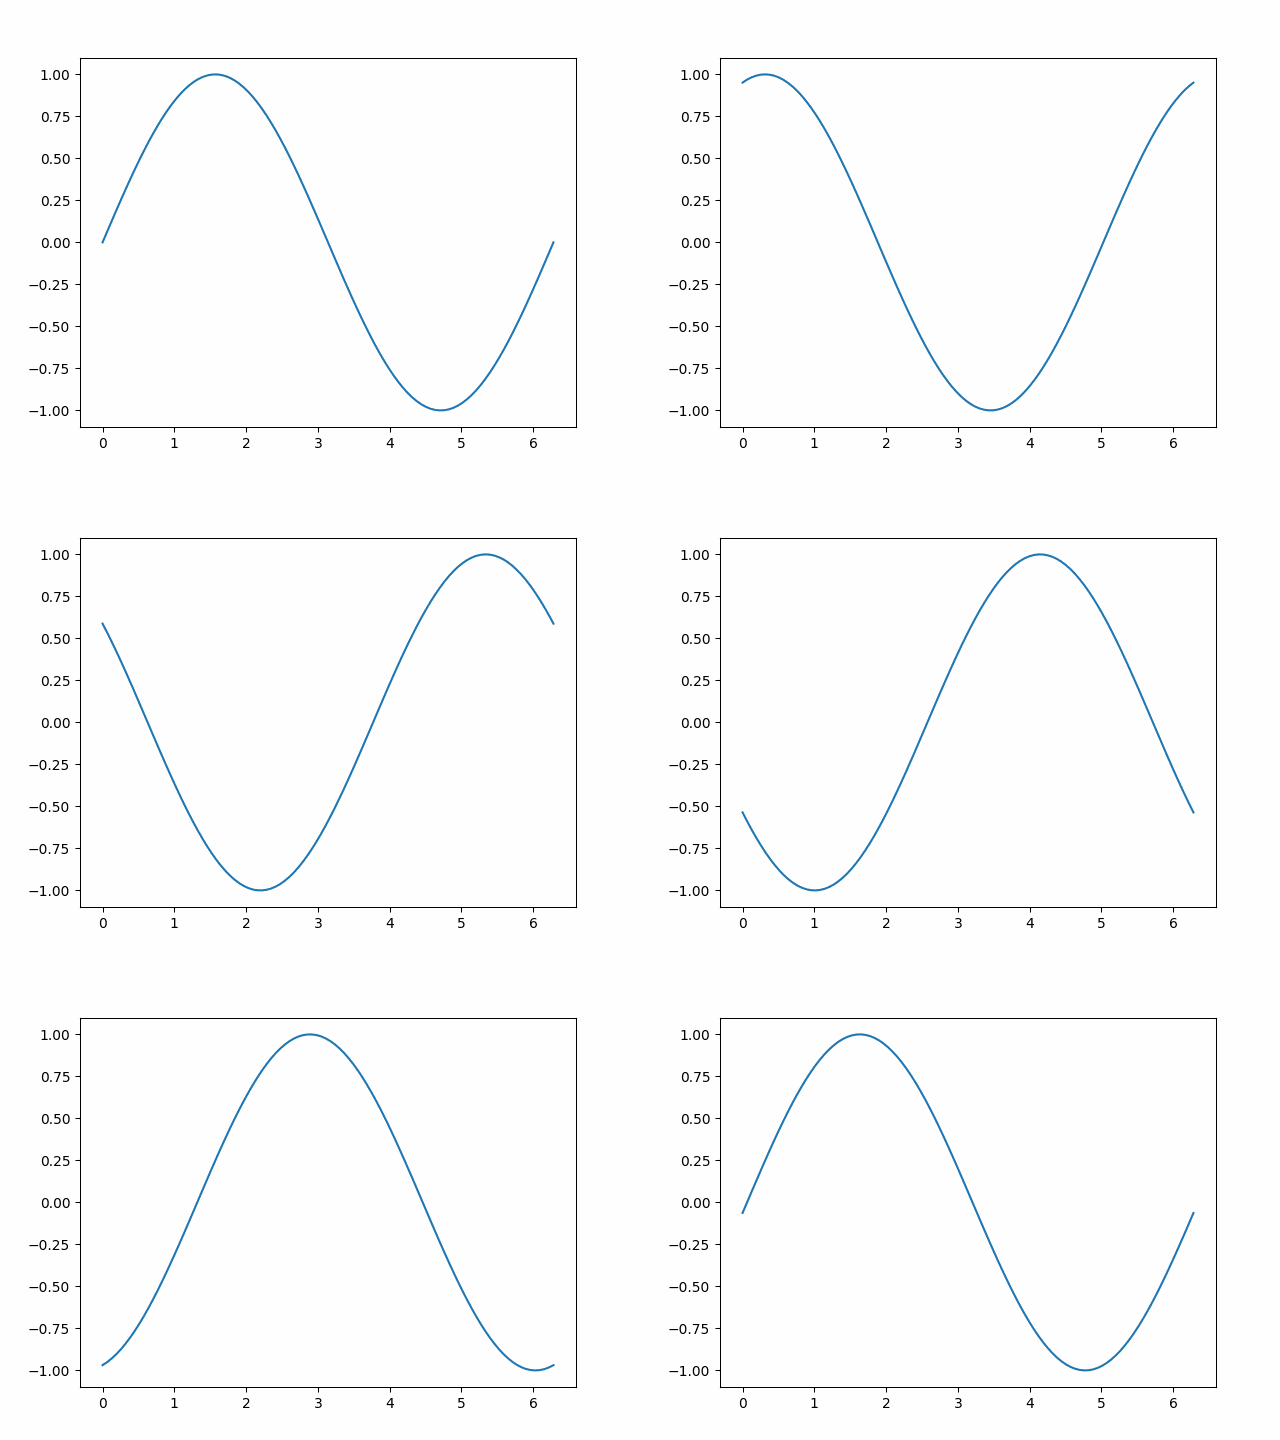
If you want to create an animated plot using the matplotlib library directly, you can use the print_animation function from the MecSimCalc library. The print_animation function takes in the FuncAnimation and returns the animation as an html string.
import matplotlib.pyplot as plt
from matplotlib.animation import FuncAnimation
import numpy as np
import mecsimcalc as msc

def main(inputs):
  fig, ax = plt.subplots()
  x = np.linspace(0, 2*np.pi, 100)
  y = np.sin(x)
  line, = ax.plot(x, y)

  def update(frame): # This function will be called for each frame
    phase_shift = 2 * np.pi * (frame / 100)
    line.set_ydata(np.sin(x + phase_shift))
    return line,

  ani = FuncAnimation(fig, update, frames = 100)
  animation = msc.print_animation(ani)

  return {'animation': animation}
Output
The plot below shows a sine wave that changes over time. The animation will run for 5 seconds.
{{outputs.animation}}
