Example 2: Exploring the COS Function
This tutorial provides instructions to create this web-based Python app to plot the cos function for particular parameters provided by the user. The user is required to provide the parameters and in the equation along with the limits and of the plot.
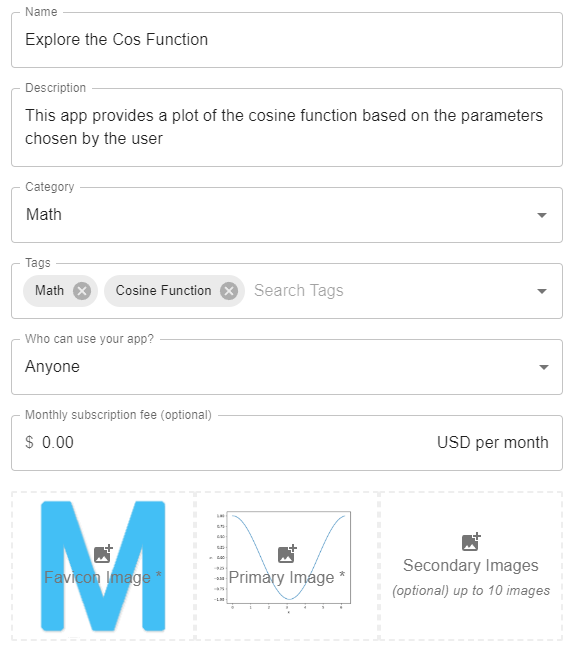
Step 1: Info
- You can fill in the required fields as shown in the following image.
- You can use the default Favicon Image.
- The Primary Image used is available here.
Step 2: Inputs
Start by creating the input group: "Function Parameters" and two numerical input variables.
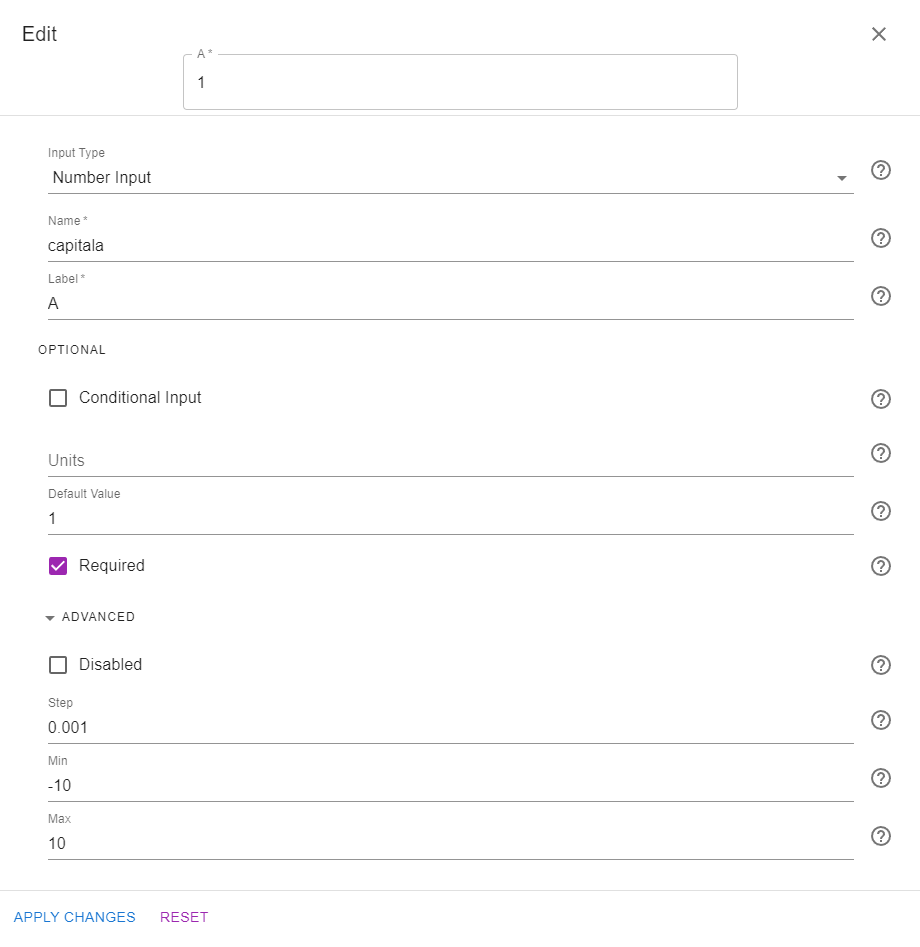
Edit the first input variable:
- Set the variable name to
capitala. - Set label to "A".
- Set the default value to 1
- Restrict the range between a min of -10 and a max of 10 with a step of 0.001.
Click on APPLY CHANGES to save your work:
Similarly, apply the changes shown in the following image to the second input.

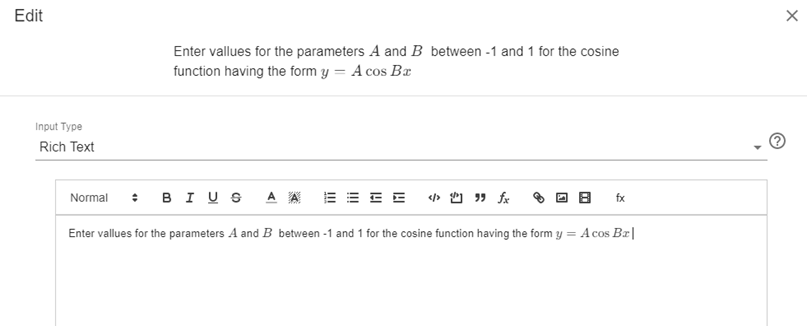
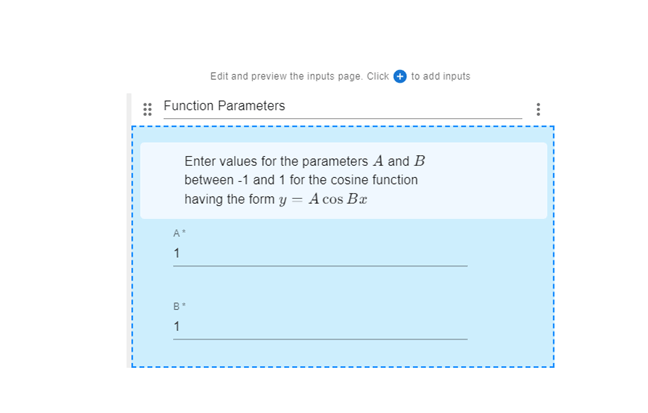
You can also add a rich text input that clarifies to the user the form that the cosine equation uses and the limits of the parameters "A" and "B". To do so, click on the ![]() button and drag in a RichText input. Hover over the recently created input and click on the
button and drag in a RichText input. Hover over the recently created input and click on the ![]() button to edit it. Add the required text and use the latex equation generator if desired, as shown in the following image:
button to edit it. Add the required text and use the latex equation generator if desired, as shown in the following image:
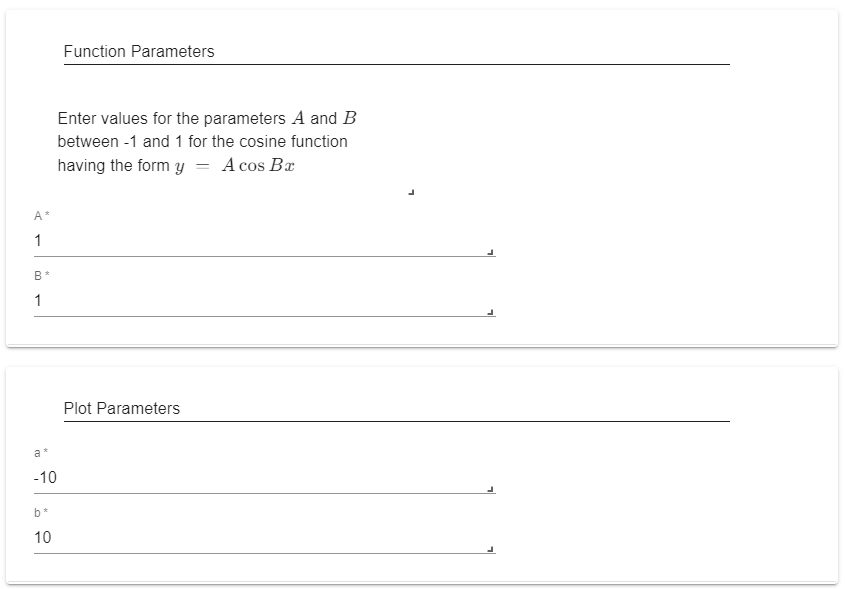
You should now see the following inputs on your screen:
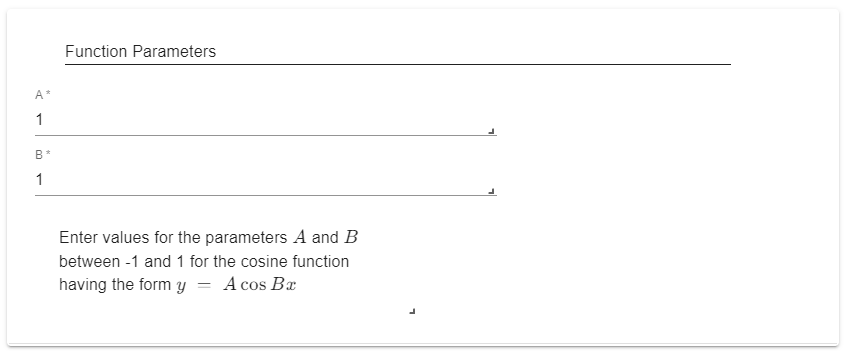
Using your mouse, drag the rich text field and move it above the parameters "A" and "B":
Now, go ahead and create a new input group titled: "Plot Parameters". Create two inputs "a" and "b" to specify the left and right boundaries of the plot. Set their variable names as a and b respectively. Change their default values to -10 and 10 respectively. You should now see the following on your screen:
Step 3: Code
As described in Generating Graphics, you need to first define the main function, and then use the msc.print_plot() function to generate the required plot:
import matplotlib.pyplot as plt
import numpy as np
import mecsimcalc as msc

def main(inputs):
    # Write code to generate a plot using matplotlib (plt)

    # The following line uses the msc.print_plot() function to create an HTML image
    img = msc.print_plot(plt)
    return {"Image": img}
To access the inputs generated in the previous step, click on <> Input Variables, and copy each variable and paste it in a new variable assignment inside the main function:
def main(inputs):
    A = inputs['capitala']
    B = inputs['capitalb']
    a = inputs['a']
    b = inputs['b']
    # Code to generate a plot using matplotlib (plt)

    # The following line uses the msc.print_plot() function to create an HTML image
    img = msc.print_plot(plt)
    return {"Image": img}
You can now use matplotlib functions to generate the required plot:
import matplotlib.pyplot as plt
import numpy as np
import mecsimcalc as msc

def main(inputs):
    # Gather inputs
    A = inputs['capitala']
    B = inputs['capitalb']
    a = inputs['a']
    b = inputs['b']

    # Code to generate a plot using matplotlib (plt)
    x = np.arange(a,b,0.01)
    y = A*(np.cos(B*x))
    plt.plot(x,y)
    plt.xlabel("x")
    plt.ylabel("y")

    # The following line uses the msc.print_plot() function to create an HTML image
    img = msc.print_plot(plt)
    return {"Image": img}
Step 4: Output
You can simply output the image generated by the code:

Step 5: Docs
You can skip adding any documentation for this tutorial.
Step 6: Preview
In the preview section, confirm that the app works as expected:
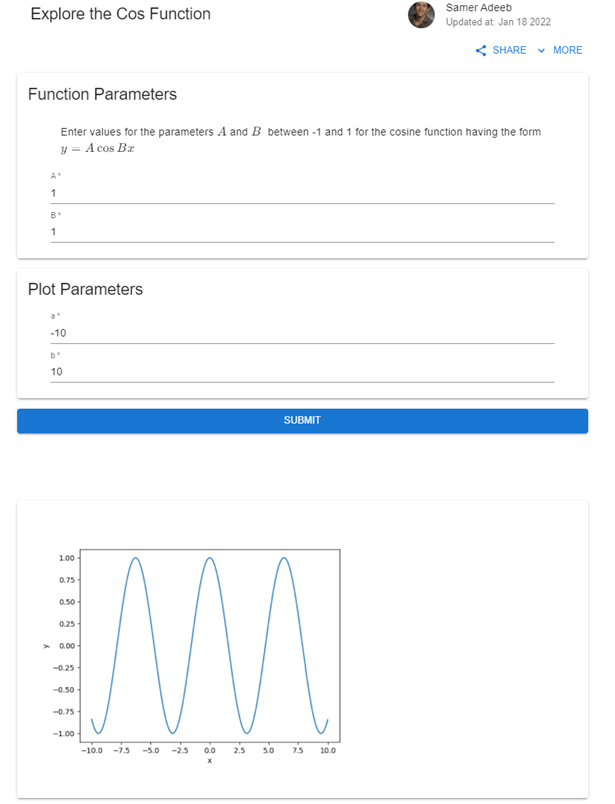
Once ready, click on PUBLISH to publish the app on the web. This version of the app is available here:
https://www.mecsimcalc.com/app/5862152/explore_the_cos_function
Make sure to also check out the app that allows the user to input and plot any valid expression in x: