Example 3: Generating a Multiplication Table
This tutorial provides two ways to create an output table by either using a utility function or the Pandas library.
Here is a demo using the utility function:
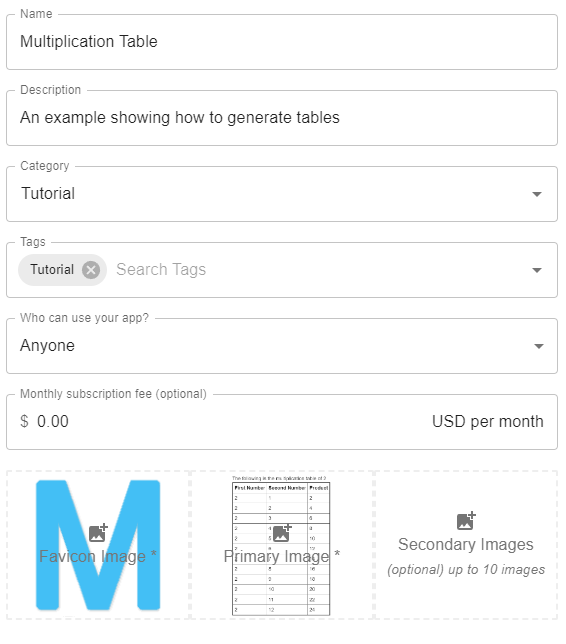
Step 1: Info
- You can fill in the required fields as shown in the following image.
- You can use the default Favicon Image.
- The Primary Image used is available here.
Step 2: Inputs
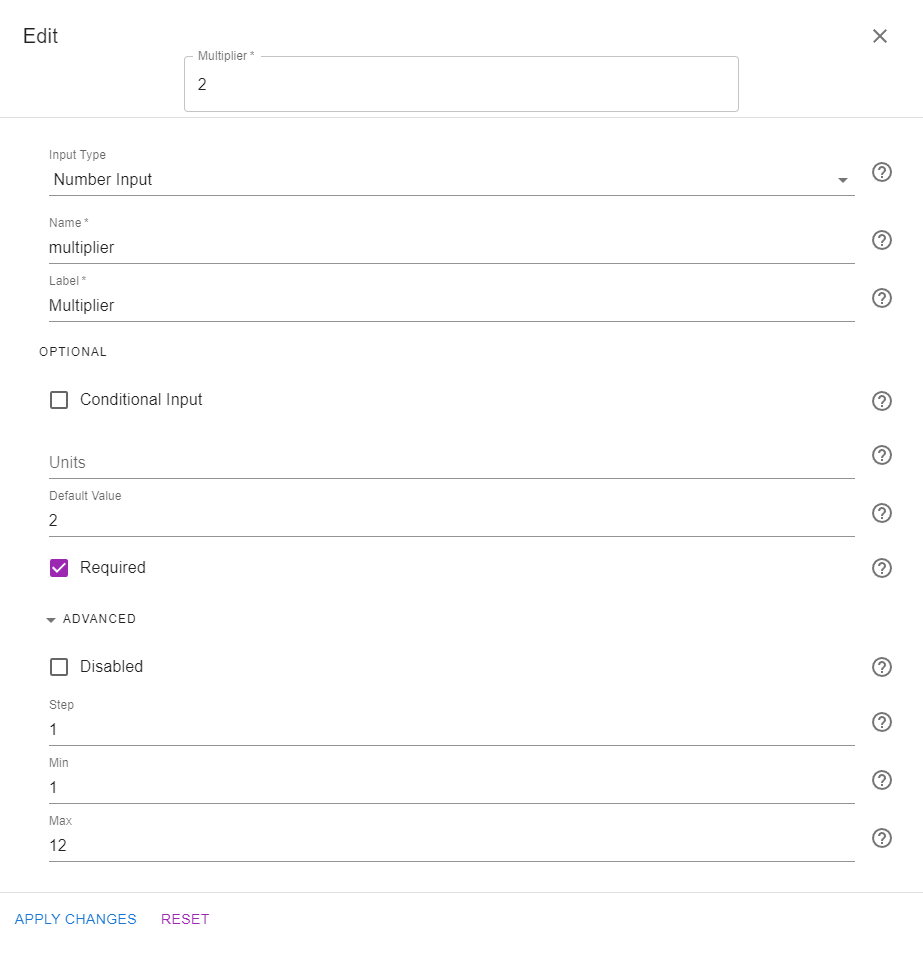
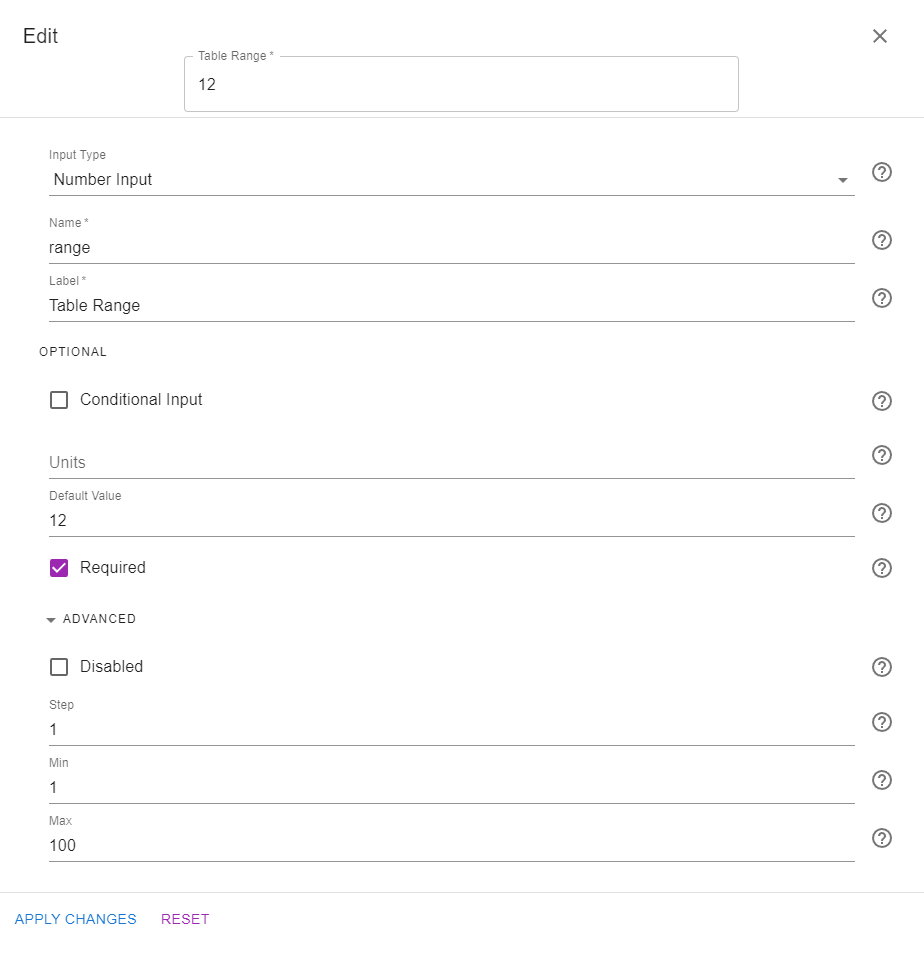
For this example, create one input group titled "Multiplication Table" with two numerical inputs: "Multiplier" and "Table Range". The variable names assigned to these inputs are multiplier and range. The following image shows the inputs step after creating these inputs:

The following two images show the settings used for each of the inputs:
Step 3: Code
We are going to present two different versions of the code that can be used to generate tables.
In the first version, we will be using the print_table function from the mecsimcalc library. This function takes two arguments: the column headers and the rows. The rows are passed as a list of lists, where each list represents a row. The following code snippet shows how to use this function to generate a multiplication table:
import mecsimcalc as msc

def main(inputs):
    m = inputs['multiplier']
    r = inputs['range']

    # Create the rows and column headers
    rows = [[m,i+1,m*(i+1)] for i in range(r)]
    ColumnHeaders = ["First Number", "Second Number","Product"]

    # Generate the HTML table using the mecsimcalc library
    table = msc.print_table(ColumnHeaders, rows)
    return { "Multiplier": m, "Table": table }
In the second version, we are going to use the Pandas library to first create a Pandas dataframe, and then convert the dataframe into an HTML table, using .to_html():
import pandas as pd
import mecimcalc as msc

def main(inputs):
    m = inputs['multiplier']
    r = inputs['range']

    # Create the rows and column headers
    rows = [[m,i+1,m*(i+1)] for i in range(r)]
    ColumnHeaders = ["First Number", "Second Number","Product"]

    # Convert the columns and headers into a dataframe
    df = msc.table_to_dataframe(ColumnHeaders, rows)

    # Convert the dataframe into an HTML table
    table = df.to_html(index=False)

    return {"Multiplier": m, "Table":table }
Both versions return an HTML table that can be embedded directly into the output page as shown in the next step.
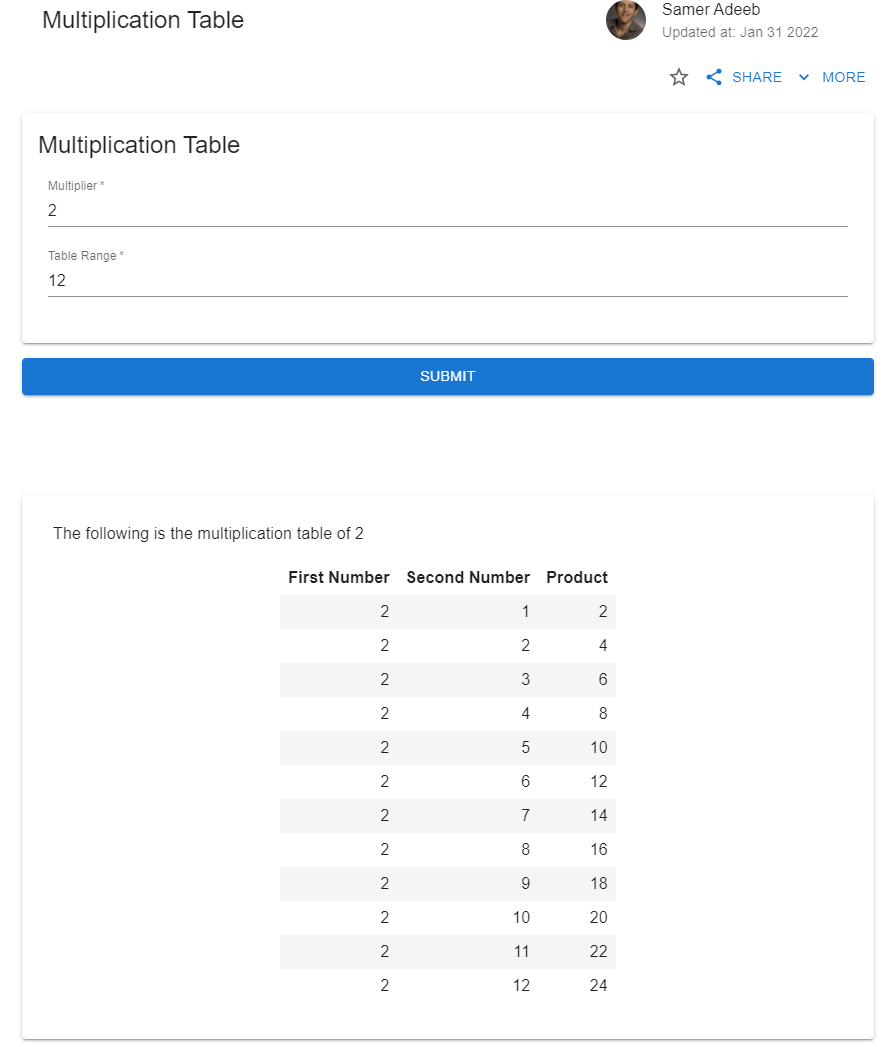
Step 4: Output
The output page used for this example is shown in the following image:

Step 5: Docs
You can skip adding documentation for this tutorial.
Step 6: Preview
In the preview section, confirm that the app works as expected:
Once ready, click on PUBLISH to publish the app on the web. The two versions of the app are available here: